The short answer
- A dashboard is only useful if a number moving would change what you do
- Daily: jobs at risk. Weekly: on-time and reprints. Monthly: margin and cash
- Revenue charts are the most looked at and the least decision-changing
- A report built on incomplete data is worse than none — it will be trusted
- Six reports is plenty; the rest is decoration
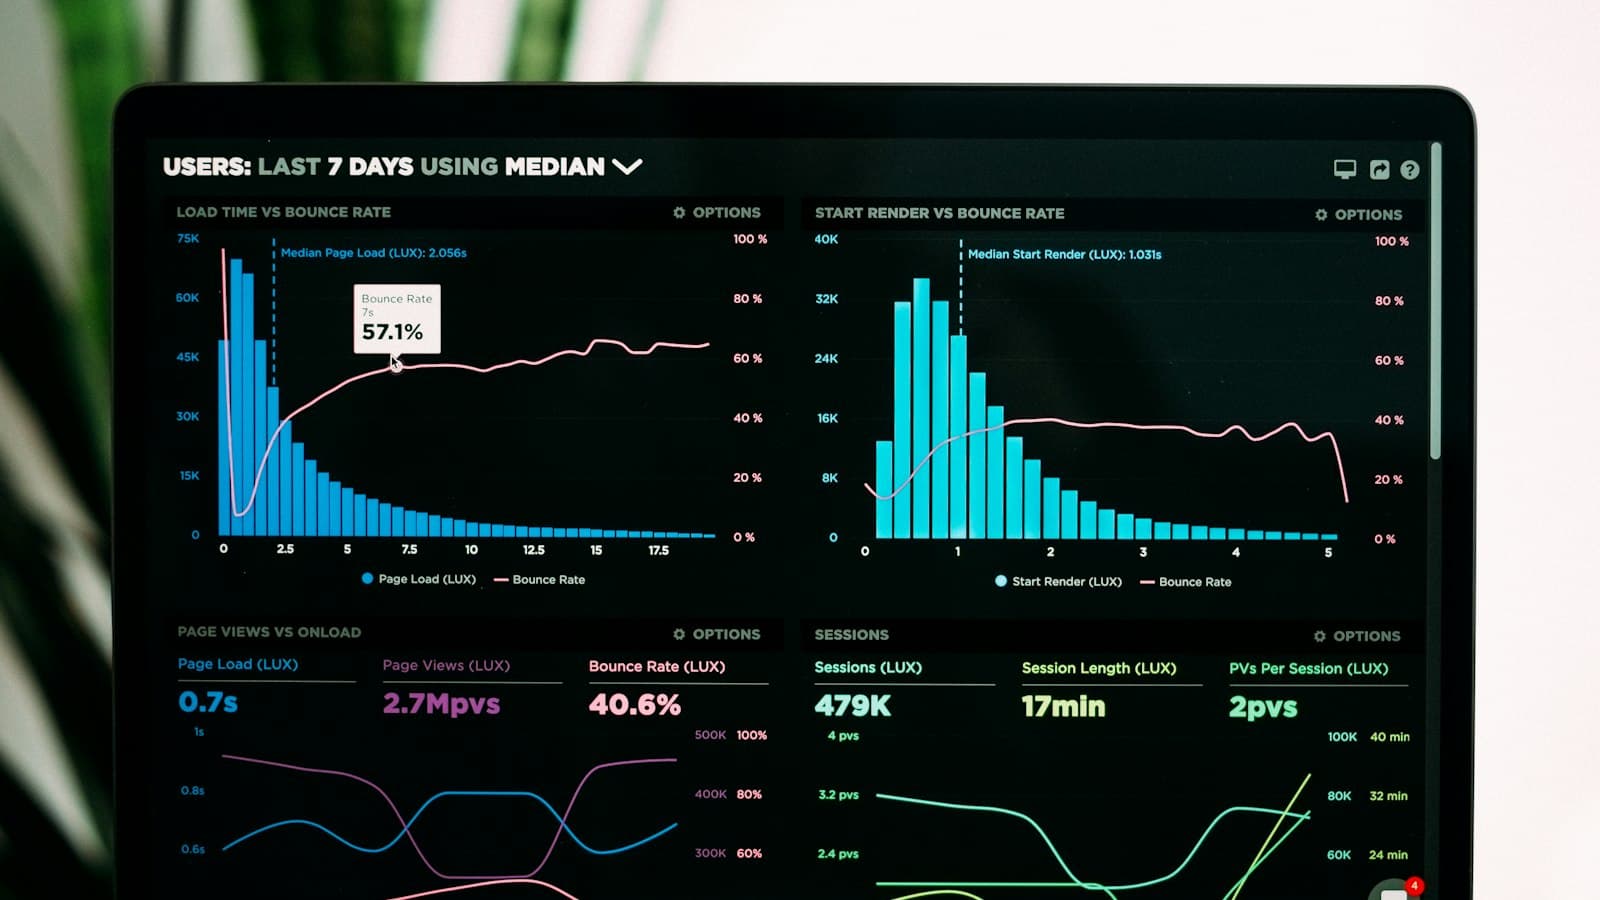
Every platform offers dashboards and most of them show the same things: revenue over time, orders by month, a pie chart of something. Those are easy to produce and rarely change a decision, which is why owners look at them for a fortnight and then stop.
A report is worth building if a movement in it would cause you to do something differently. That is the whole test.
Why dashboards disappoint
| Problem | Effect |
|---|---|
| Shows outcomes, not causes | Tells you last month was bad, not why |
| Too many numbers | Nothing stands out; nobody looks |
| Built on incomplete data | Trusted, and wrong |
| No action attached | Interesting, then ignored |
| Wrong frequency | Noisy weekly, stale monthly |
The first is the fundamental one. Revenue is an outcome — by the time it moves, whatever caused it happened weeks earlier, and the chart cannot say which of a dozen causes it was. The useful numbers are the ones that move first.
If a number moved and you would not do anything differently, do not put it on a screen.
The six reports
| Report | Frequency | Action it triggers |
|---|---|---|
| Jobs at risk | Daily | Reschedule, or warn a customer |
| Waiting on someone else | Daily | Chase an approval or a delivery |
| On-time rate | Weekly | Investigate the schedule |
| Reprints by cause | Weekly | Fix a machine or a process |
| Margin by job type | Monthly | Reprice or decline a category |
| Days to payment and cash gap | Monthly | Tighten terms |
Six is enough. Each has a named action, each moves before revenue does, and together they explain almost every bad quarter — which is the same list as the numbers worth measuring, arranged by how often to look.
Daily
Two lists, looked at each morning in the same ten minutes.
Jobs at risk. Anything whose remaining production time exceeds the time before its due date. This is the single most valuable screen in shop software, and it is the reason a scheduler is worth having — not the calendar, the risk flag.
Waiting on someone else. Jobs blocked on a customer approval, a supplier delivery or artwork. These are invisible on a production board because they are not late yet, and they are the commonest cause of a comfortable schedule becoming a rush.
Both should be lists of jobs, not counts. A number tells you there is a problem; a list tells you which ones to act on.
Weekly
On-time rate. Delivered by the date the customer was told, not the date you hoped for. Weekly is the right frequency because a bad week should be visible while people still remember what happened in it.
Reprints by cause. Grouped, not counted. Six reprints in a week is a number; four of them caused by registration is a diagnosis pointing at adhesive, pallets or press wear.
Read them together
- On-time falling, volume flat → process or approval bottleneck
- On-time falling, volume rising → genuine capacity problem
- Reprints rising, one cause → fix that cause
- Reprints rising, spread → likely a machine drifting
- Both stable → the schedule has enough slack
Monthly
Margin by job type. Not overall margin, which hides everything. Almost every shop has a category it is quietly losing on, and an average conceals it perfectly — usually small orders, where setup does not spread.
Days to payment and the cash gap. The real interval from invoice to money, and the gap between paying suppliers and being paid. That gap is what makes a profitable shop feel short of cash, and it only becomes actionable once it is a number.
Review them together, in the same half hour, in the same order every month. The value is in the pattern across reports rather than in any single figure.
Making them trustworthy
A report is only as good as the data underneath, and a report built on partially entered data is worse than none — because people will act on it.
Before trusting a report
- Check the underlying data is complete — are all jobs in the system?
- Confirm statuses are updated as work happens, not at the end of the day
- Verify one month by hand against your own records
- Establish what is excluded — cancelled jobs, samples, internal work
- Re-check after any process change
The second point is where most shop reporting fails. Statuses updated from memory at five o'clock produce an on-time rate that reflects recollection rather than reality — which is why making the system the fastest path matters more to reporting than any dashboard feature.
Verify one month by hand the first time. It takes an hour, it either builds confidence or finds a gap, and both outcomes are worth more than a year of looking at numbers you are not sure about. The rest of the software archive assumes your reports are built on complete data.
Who looks at what
Reports get ignored when everybody is shown everything. Different people need different views, and narrowing what each sees makes it far more likely to be acted on.
A sensible split
- Production — jobs at risk, jobs waiting, today's schedule
- Sales — quotes outstanding, quote-to-order rate, reorders due
- Owner — on-time, reprints, margin by type, cash gap
The production list is the one that changes daily behaviour, and it should be visible where the work happens rather than in an office. A screen on the shop floor showing what is at risk today is worth more than a monthly report nobody opens.
Set that up alongside the roles you have already defined for access — the same division of responsibility applies, and it means each person opens something short enough to read.